
Mastering Moving Averages: The Ultimate Guide to Compute Them Using Microsoft Excel
Mastering Moving Averages: The Ultimate Guide to Compute Them Using Microsoft Excel
Quick Links
You may think of a moving average for forecasting stocks or investments . But you can also use it to see trends for inventory, sales, or similar data. Without equations or functions, you can calculate a moving average easily in Excel.
Related: How to Use the Built-In Stocks Feature in Microsoft Excel
Add the Data Analysis Tool in Excel
While you can perform calculations and create a line graph to display your moving average in Excel, there’s an easier way.
Microsoft offers a free Analysis ToolPak that you can add to Excel. The tool lets you develop statistical or engineering analyses with a variety of functions. One such option is a moving average.
To see if you already have the Analysis ToolPak, go to the Data tab and look for the Data Analysis button in the Analysis section of the ribbon.
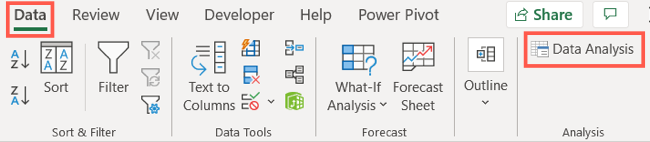

If you have the button, you’re good to go and can move on to calculating a moving average below. If not, here’s you can add it quickly.
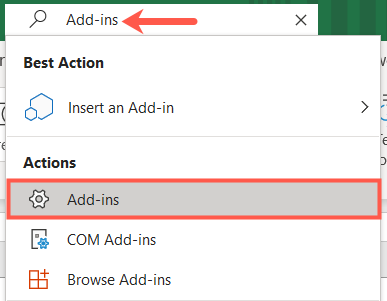
Go to the Search box at the top of Excel and enter “Add-ins.” When you see Add-ins in the list, select it.
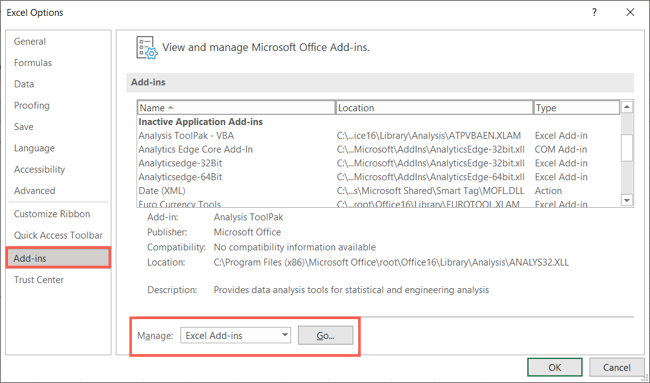
Alternatively, click File > Options and select “Add-ins” on the left. At the bottom of the window, next to Manage, pick “Excel Add-ins” and click “Go.”
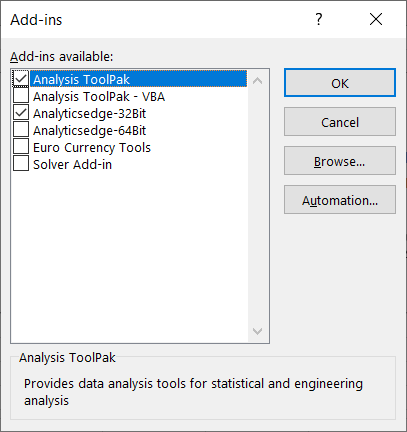
After the Add-ins window displays, check the box next to Analysis ToolPak and click “OK.”
Now when you head to the Data tab, you should see the Data Analysis button in the ribbon.
Related: How to Get Microsoft Excel to Calculate Uncertainty
Calculate a Moving Average
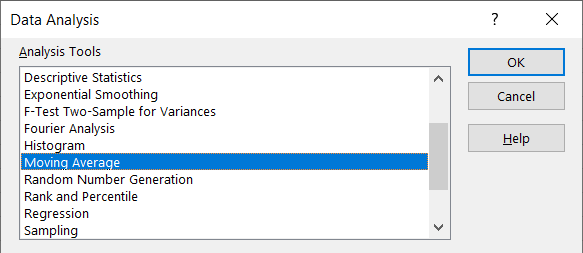
When you’re ready to calculate the moving average, click the Data Analysis button on the Data tab. Select “Moving Average” from the list and click “OK.”
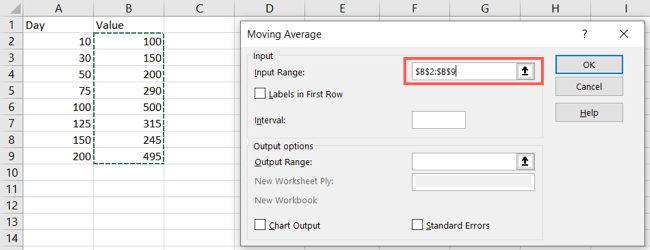
At the top of the Moving Average window, enter the Input Range into the corresponding box. You can also click inside the box and then drag through your data range. Optionally, you can check the box for “Labels in First Row” and include an Interval.
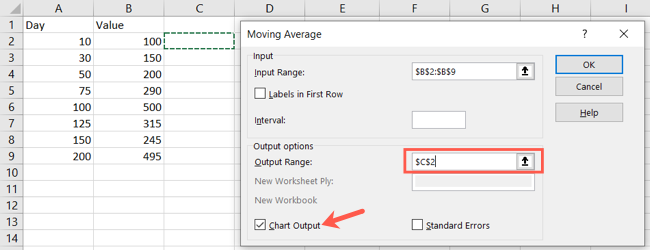
Next, enter the Output Range by entering a cell reference or clicking inside the box and selecting a cell on your sheet. Optionally, you can check the box for Standard Errors. And to create a graph of the moving average as well as receive the results, check the box for Chart Output.
When you finish setting up the moving average click “OK” and you’ll see the output. You have the values beginning in the cell you selected for the output. If you selected the Chart Output, you’ll have a handy line graph displaying the data as well.
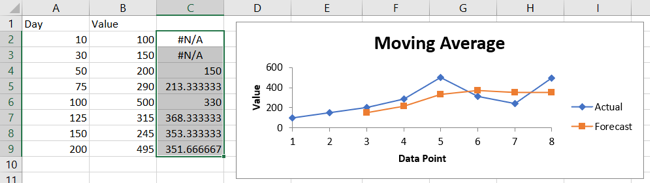
You can customize the Moving Average graph like any other chart you create in Excel . Select the graph and use the Chart Design tab to adjust the layout, colors, legend, and more.
Be sure to check out the other options available with the Analysis ToolPak. You can do things like create a histogram , find a correlation, or use the random number generator.
Also read:
- [New] Navigating the Acquisition of Stock Video Backgrounds
- [Updated] Pro-Level Insights for Perfectly Crafted Snaps for 2024
- Crafting Colours with Care Top 5 Displays Reviewed for 2024
- Essential Guide to Installing Windows Drivers on Your HP Spectre X36er
- How to Easily Update Your USB-C Drivers on Microsoft's Newest OS - Windows 11
- In 2024, 5 Tutorials on How to Transfer Photos From Apple iPhone 6s to New iPhone | Dr.fone
- Installing Updated Canon MG3600 Driver Software: A Step-by-Step Guide
- Latest Canon MF7n3CDW Printer Driver Software for Microsoft Windows Devices
- Mastering iPhone's Simple Recording Features Quickly
- Overcoming the 'Unauthorized Access' Warnings for Gamers
- Quick & Effortless Download of Synaptic Device Drivers for Windows Systems
- Solution: Vaccination Against Rubella Prior to Pregnancy Is Highly Effective in Preventing Congenital Rubella Syndrome.
- Unlock the Art of Midjourney Prompt Creation: A Comprehensive Journey From Startup to Maestro
- Title: Mastering Moving Averages: The Ultimate Guide to Compute Them Using Microsoft Excel
- Author: David
- Created at : 2024-10-14 17:01:40
- Updated at : 2024-10-20 18:27:20
- Link: https://win-dash.techidaily.com/mastering-moving-averages-the-ultimate-guide-to-compute-them-using-microsoft-excel/
- License: This work is licensed under CC BY-NC-SA 4.0.